Track daily, weekly, and monthly performance data with Pi
19 Dec 2023|2 MIN READ
Utilize daily, weekly, and monthly performance data to visualize how your rankings (and your competitors’ rankings) change over time.
Without in-depth performance data, it’s almost impossible to successfully inform your SEO campaigns. With no level of detail, how can you keep track of how you perform versus your biggest competitors? Which keywords are you being outperformed on? And how can you report on campaign success with conviction?
With extensive filters, Pi’s Position Explorer tools allow you to pinpoint the data you need, fast.
At a glance, you’ll uncover which competitors are closing the gaps and understand which SEO campaigns have been a success (and which ones might need some tweaking).
Being truly site agnostic, Position Explorer Table can display any site’s data, allowing you to immediately identify specific search terms that have contributed to the rise or fall of ranking position and the URLs they relate to.
So you have a full overview of your entire keyword universe – making it easy to report on the success of a campaign and identify the content that might need tweaking.
“Using Position Explorer charts it is easy to see when issues arise, when competitors start closing gaps, or when SEO campaigns have been successful. Using Position Explorer tables and drill-downs we are then immediately able to identify specific keywords that have contributed to rises and falls and the URLs they relate to.” – Satisfied Pi user

Get granular with performance data
Position Explorer Table is used to explore granular search term performance data. The Position Explorer Table reveals the highest-ranking URL for a search term on a particular day, week, or month.
You can choose to analyze a single search term to understand its performance across multiple sites in the selected Workspace.
Or choose to analyze multiple search terms within the selected Workspace to understand their performance across a single site (yours or one of your competitors).
You can also select SERP features to be included in the Position Explorer Table – offering a view of the entire SERP landscape.
Identify internal conflict using daily data
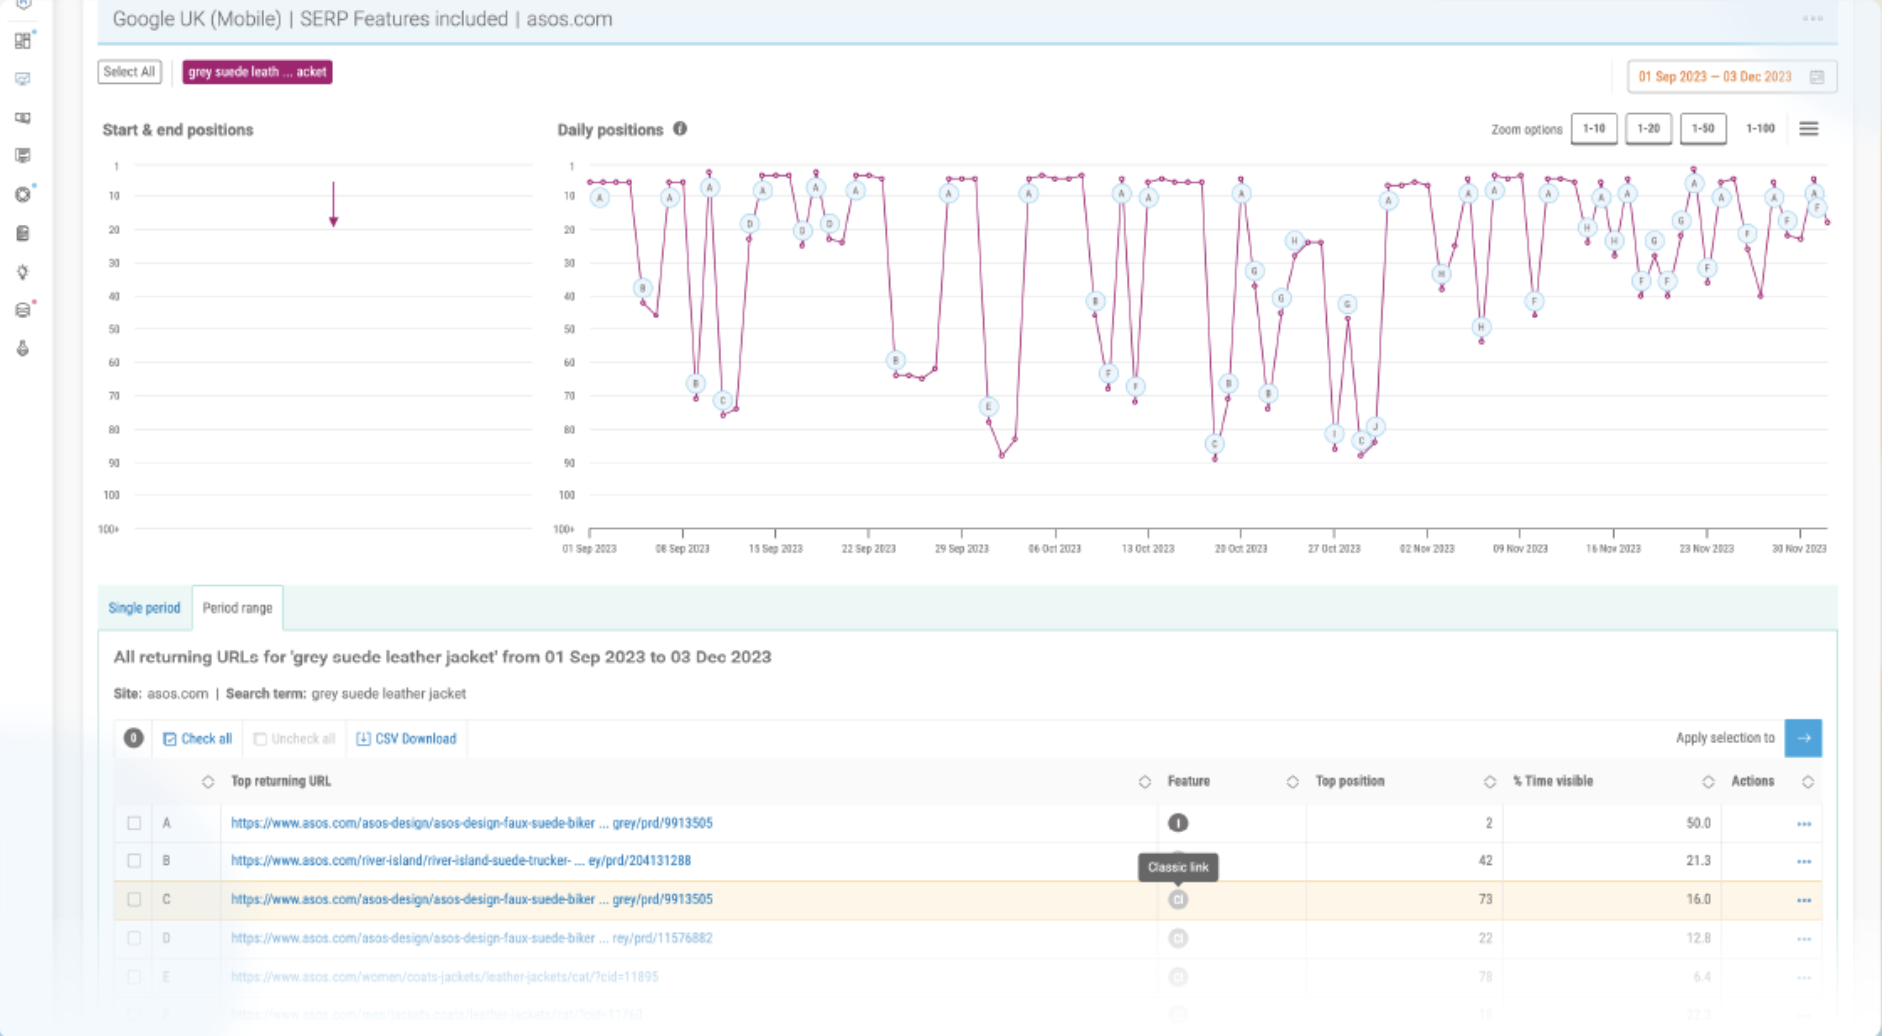
To analyze the data even further, you can select ‘Position Explorer Chart’ to reveal the timeline dynamic between specific ranking search terms, URLs, and SERP features.
Having the ability to track daily data means you can quickly pinpoint conflicting search terms. Use the Position Explorer Chart to identify the URLs dropping in and out of the top 10 positions and get to the bottom of these conflicting terms.
When asked what they liked best about Pi’s Search Intelligence Platform, customers stated:
“Pi Datametrics really shines when it comes to showcasing keyword depth. After you’ve handpicked the keywords you want to examine in detail, Pi not only makes it simple to showcase how your website is ranking, but exactly which URL is ranking for these keywords, and if more than one URL is competing for the same keyword.”
Excited to see Pi’s Position Explorer tools in action for yourself? Book your demo!
See Position Explorer in action
Never miss a post
Join our mailing list and have our SEO news delivered straight to your inbox.
Never miss a post
Join our mailing list and have our SEO news delivered straight to your inbox.


